How to Know If Your Conversion Campaign Is Actually Performing
Discover the one metric that matters most: Click-Through Rate (CTR). Learn the exact benchmarks RealUp uses for conversion-focused campaigns and how to optimize based on real performance data.
1 min read

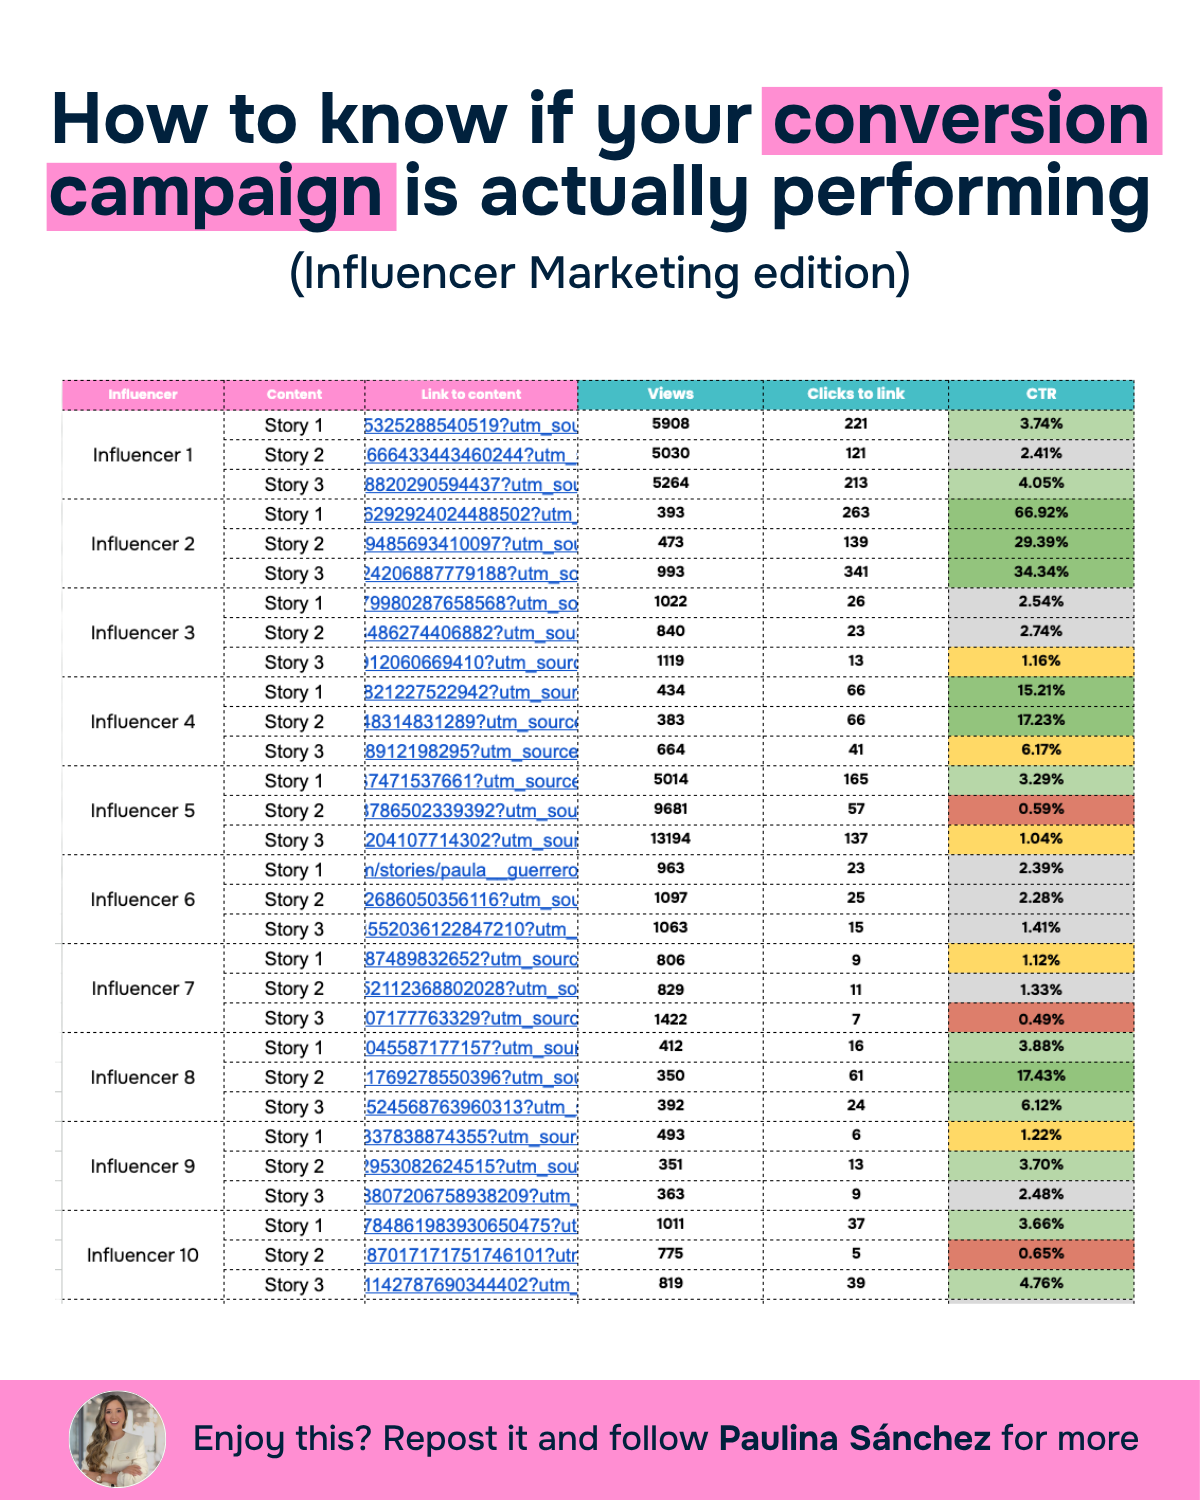
It comes down to one thing: knowing your Click-Through Rate (CTR) benchmarks and making decisions based on them.
These are the exact CTR benchmarks we use at RealUp for conversion-focused campaigns
Micro-influencers in Instagram (10K–100K followers):
→ Best in class: 7% – 60%+
→ Above average: 3% – 6.95%
→ Average: 1.30% – 2.95%
→ Under average: 0.70% – 1.25%
→ Underperforming: 0% – 0.65%
The mistake most CMOs make:
They run a conversion campaign and optimize for engagement rate alone.
A creator can have 6% ER and 0.3% CTR. High engagement does not mean high intent to act.
CTR is the metric that tells you whether people are interested enough actually to click, not just watch, not just like.
How to use this:
Pull CTR data from your last campaign. Calculate: Total link clicks ÷ Total impressions × 100
Then compare:
→ Above 3%? Strong performer. Scale that creator.
→ 1.30%–2.95%? Average. Test content and CTA optimizations.
→ Below 0.70%? Underperforming. Audit the brief before pulling the creator.
→ 0%–0.65%? Restructure the campaign or walk away.
Enjoy this?
Follow me on LinkedIn